


 Feature articles

Active GUI element
Static GUI element
Code
WPS object
File/Path
Command line
Entry-field content
[Key combination]
Using Theseus to Study Memory Usage Under OS/2
Part 2
Most OS/2 users probably have suffered from memory-related problems, even if they don't know it. With some knowledge of the mechanisms at work, the comprehensive tool Theseus from IBM can investigate such matters and find possible culprits and solutions.
Memory Leak Detection
You will find the Memory Leak Detection feature at two places: Under System for a global memory leak detection and under Process for the detailed memory leak detection of an individual process.
Memory Leaks
What is a memory leak? Was Firefox leaking memory when it allocated 357 MB of virtual memory and even got 277 MB in RAM? Or had the memory usage a purpose, like the intentional growth of the WPS? As always, everything can be seen as seen as a bug or a feature. It depends on the attitudes and expectations of programmers, their managers, and end-users.
When an application or system module allocates new memory, the allocated memory space should be used for code or data by functions at the behest of the end-user. But if the data files were closed and the features were not needed any more, programmers used to deallocate the unused memory address space.
Programmers who worked with small fixed memory resources always needed to free memory for new code and data, but protected-mode programmers who use virtual memory do not easily run out of memory. If they fail to deallocate unneeded memory space properly, most programs continue on.
Some programmers even found arguments not to deallocate unused memory: Deallocating memory would slow down their programs and—if it was wrongly implemented—could even halt the program. The impaired operation or crash would be noticed by end-users, but the “behind the screen” wasting of private memory was not. Unused memory addresses would be swapped out to disk or could stay in memory on memory-rich systems. So protected-mode programmers were more interested in developing new features for new releases than to spend time on the boring job of debugging things.
Consequences of Memory Leaks
New features are always welcome, but because of the limited capacity of OS/2's shared arena, instability inevitably occurs when programs grow like weeds in the garden.
The obvious consequence of a memory leak is that memory usage in RAM steadily grows. When there is little free physical memory left, OS/2 becomes less responsive and the SWAPPER.DAT grows.
But if a program did only the above, it would be a relatively innocent phenomenon. The memory manager of OS/2 can handle situations of overcommitment. The growing program would simply be detected in System > RAM Usage by process. When it was closed and restarted, OS/2 would run fine again.
Sadly, there is also a very dangerous kind of memory leak, working underground by allocating memory without using it. As OS/2 commits virtual memory lazily, a program could have a small working set and little committed memory in RAM (as seen in RAM Usage by Process)), but still might allocate enough address space to cause PM Shell or the WPS to suddenly run out of virtual memory.
So on systems with a lot of RAM it is very important to check the allocated memory, especially when you run out of virtual address space. Excessive use of low shared memory can be seen in Process > Memory Utilization. It might a big process like Mozilla that does this, but it also might be a relatively small one. When you have 10 MB of shared virtual memory free, any big droplet may fill the bucket.
Because OS/2 programs share memory with other programs with very different APIs, the effects of memory leaks may even be visible when the memory-leaking program is closed. Especially when the program is closed in an unofficial way (killing it instead of closing) or improperly closed using the OS/2 API like a Windows program under ODIN.
In the example below you see a piece of writeable (W) memory at linear address hex 156F 0000 with the very
appropriate text: Virtual Memory Problems Under OS/2.
Theseus warns me that the shared memory does not have a
Module Table Entry (MTE), which means that it is not associated with the original DLL (like PMMERGE.DLL at address 1574 0000) or a program
any more.
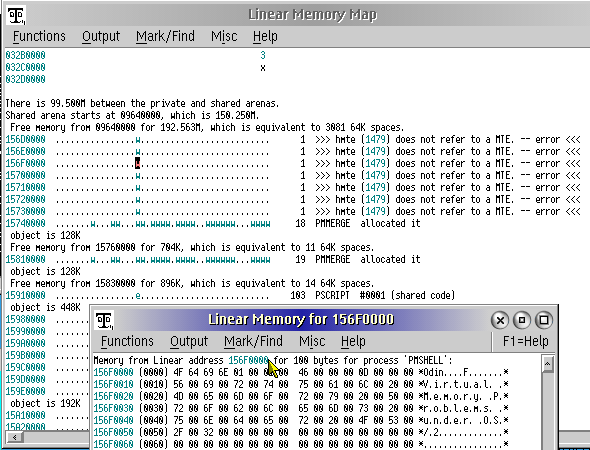
Figure 7. Example display of writable memory with clipboard text
The text was put in the PM clipboard by Innotek's port of OpenOffice 1.1.4, which was normally closed. But the text was still associated with Odin, as the handle of the MTE (hmte 1479) referred to Virtual PC. When VPC was closed as well, the leaked memory disappeared.
Memory leak detection and prevention is not easy. If you want to read more about it look for MEMLKS.ZIP with Google.
Memory Leak Detection Functions of Theseus
To have an overview of virtual memory consumption of the whole system go to Theseus > System > Memory Leak Detection. Choose Functions > Leak Detection Control > Use previous sample as base. Now choose Functions > Start Periodic Leak Detection.
Memory leak detection:
Use the 'Function' pull-down to start and stop the data collection.
Leak data captured.
Previous sample will be used as the base.
Periodic update started with interval of 0:30.
Theseus measures the amount 4 KB pages that are allocated (promised), committed (touched), and actual in RAM. I concentrated on Mozilla Firefox. I opened it with Google, opened 17 URLs at once, closed them, and returned to the Google homepage.
-
Startup Firefox with Google: More memory is allocated then committed.
----------Private-----------  -----------Shared-----------
Allocated  Committed  Actual  Allocated  Committed  Actual   PID   Name
   +12640      +4685   +3333                 +6962   +5655  007E  +MOZILLA
-
Quickly open 17 links via Open in Tabs: More virtual memory is allocated, but even more is committed during the second interval. This is the “lazily committed” memory from the first 30 seconds.
----------Private----------- -----------Shared----------- Allocated Committed Actual Allocated Committed Actual PID Name +10096 +11082 +10424 +363 +469 007E MOZILLA ----------Private----------- -----------Shared----------- Allocated Committed Actual Allocated Committed Actual PID Name +576 +553 +533 +400 +78 007E MOZILLA -
Close all tabs, keep Google: Much less pages (-320) are deallocated, then were allocated (some 11,000) in the previous two intervals. Shared memory keeps growing.
----------Private-----------  -----------Shared-----------
Allocated  Committed  Actual  Allocated  Committed  Actual   PID   Name
     -320       -180    -149                  +200      +1  007E   MOZILLA
What is seen is the well-known Mozilla behaviour of allocating more and more memory even if you close the tabs. Bug or feature? I consider it a memory leak as I did not get more functionality for it.
If you close Firefox, restart it, select it in Theseus, and repeat the experiment, you can see which DLLs were involved under Process > Memory Leak Detection. The list is long. I can only show part of it.
Allocated   Committed   Actual    har     Address   P/S   Description
       +0          +0       +1   1418    00B10000   Pvt   DOSCALL1 allocated it
       +0          +0       +1   141E    00BF0000   Pvt   TCPIP32  allocated it
       +0       +4512    +4536   1422    00C30000   Pvt   LIBC05   allocated it
     +256        +256       +5   148C   +03160000   Pvt   NPSWF2   allocated it
      +16          +1       +1   14DA   +03270000   Pvt   FLASHWIN allocated it
And in the shared arena:
      +16         +16      +16   154D   +16160000   Shr   PMMERGE  allocated it
     +128        +121       +0   1550   +16170000   Shr   PMMERGE  allocated it
      +16          +0       +0   152C   +16AF0000   Shr   HELV     #0009 (shared data)
PMMERGE and the unofficial FLASHWIN were often involved. The Windows-derived FLASHWIN plugin can be partially loaded high, but PMMERGE.DLL always allocates low memory. So when you want to keep OS/2 stable, close the Mozilla family regularly.
Linear Usage by Process
To know how much virtual memory address space is left free in the shared arena, you could select any process and choose Theseus > Process > Shared Object Summary. Then scroll downwards (End key) and notice the Analysis of 'Free' areas as shown earlier.
But if you want to know how much usable shared memory is left, go to Theseus > System > Linear Usage by Process. Here you find a block diagram depicting the use of linear address space in the private and shared arenas.
The Private, Shared, and System Arenas
In its simplest form—with a virtual address limit of 512 MB—the arena picture looks like this. The picture and description are taken from the Theseus help file.
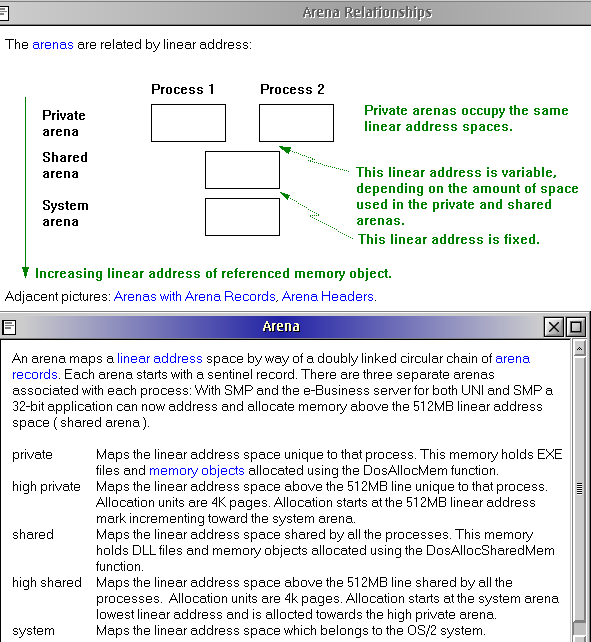
Figure 8. Memory arenas with a virtual address limit of 512 MB
Linear Usage by Process does not show the System arena. It only shows protected mode memory, virtual memory that is supervised by the kernel. The kernel itself runs in privileged mode, has access to terabytes of virtual memory, and cannot be pre-emptively interrupted. Nevertheless, protected mode processes do have a system arena, and attempts to overwrite this memory are punished by the kernel.
Of course with up to 3 GB of virtual address space per user process (the maximum virtual address limit!) the Theseus window buffer is easily filled. When Theseus is incapable of showing the full high memory arena (HMA), go to Process > Private or Shared Object Summary to see the high memory arena of a separate process.
The Private Arena
The first thing you see is the (private) Linear memory map of the running processes. The Process names are written top down, and under Address usage... you can see how much and what private virtual memory the processes occupy.
The Virtual DOS Machine (VDM) starts at hex address 0000 0000. OS/2 protected mode programs start at 0000 1000. Here they have their first (#0) virtual memory object. If it is a big object, the number is displayed several times. Consecutive memory objects are indicated by their numbers. Each line represents a 64 kB block. For an explanation see Help > Explanation of this Window.
Sometimes you see points representing unused virtual memory address space between the allocated memory objects. This indicates external fragmentation in the virtual address space of the process.
There is also a kind of internal memory fragmentation that results from memory objects being allocated in 4 KB blocks. This would result in an average waste of 2 KB per memory object. Compare it with the invisible “slack” space of file systems.
The largest process in the private arena determines the size of the shared arena.
When I had 30 user programs, each allocating only 100 MB privately and minimal shared memory, I could have a virtual machine size of more than 3 GB. The system even could run on OS/2 Warp 3 with 1 GB of RAM. As OS/2 commits memory lazily, it could work with the maximum SWAPPER.DAT of 2 GB (HPFS limit). The 30 protected mode programs would only hinder each other when they had big working sets not fitting in 1 GB of RAM.
But one big 300 MB private memory allocating process can squeeze the shared arena to 200 MB preventing the loading of any other process that needs shared memory.
So use SET JAVA_HIGH_MEMORY=1 in CONFIG.SYS when using Java, so that most
of the Java memory can be loaded high.
The Shared Arena
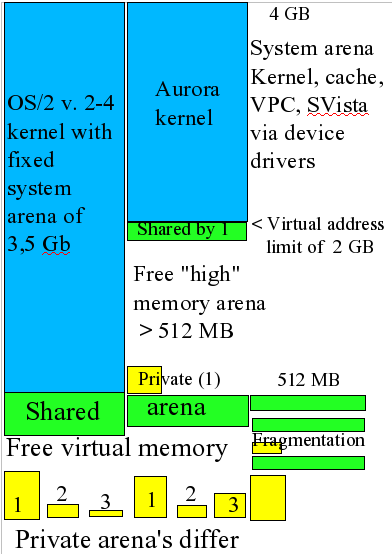
Figure 9. Comparison of memory arenas for old and new kernels with high memory support
The lower border of the shared arena is determined by the biggest process in the private arena. On freshly loaded systems there is free pool of memory between the private and shared arena.
It disappears when you load and unload more DLLs, leaving a fragmented shared arena. The upper border of the low shared arena is at 1FFF FFFF (512 MB).
Periodically shutting down and restarting the most memory consuming processes may keep you going when virtual memory is low. Reloading programs in a memory-restricted environment may force them to load more DLLs into high memory arenas.
The same holds true of any program (EXE, DLL) that is allocating a lot of shared memory. Here the effects are accumulative. The more of them you close, the more address space is available in the shared arena.
High Memory Arena
The high memory arenas of Warp Server for eBusiness and modern eCS and OS/2 kernels starts at linear address hex 2000 0000 with the high private arena. There you find a pool of free memory addresses. Located above is the high shared arena ending at the Virtual Address Limit of the CONFIG.SYS (default = 1024 MB, in the diagram at 2048 MB).
The Importance of a Free Pool of Memory
The borders between the free, private, and shared memory arenas are not strict. They change constantly, especially in the often accessed low memory arena. When a process releases memory, holes in the virtual address space appears that could be filled with other virtual memory objects that fit in the free space. But when IBM's OS/2 Memory Analysis Program Theseus says:
There is 0.000M between the private and shared arenas.
Shared arena starts at 0B670000, which is 182.438M.
Free memory from 0B670000 for 128.000M, which is equivalent to 2048 64K spaces.
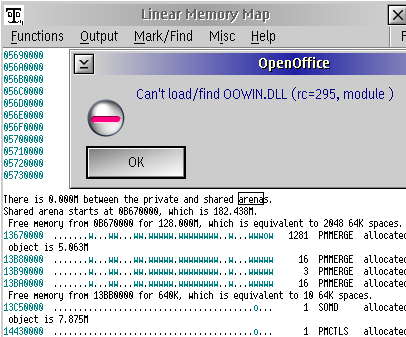
Figure 10. Failure to load OpenOffice.org due to fragmented memory
you might be in trouble; even if there is 128 MB virtual memory address space free for new or constantly growing (WPS, Mozilla) programs. The danger is that the OS/2 system loader cannot find appropriate virtual address space for the DLLs of a new or growing program (here OOWIN.DLL). The free memory objects might just be too small (like the 640K object at 0B67 0000) to allow loading a DLL. You then get an “out of memory error” even if you have 1 GB of RAM free. Remember that is only their own virtual memory that protected-mode programs can address.
To find the critical areas in the Linear Memory Map, make use of Theseus' search function: Mark > Find ([Ctrl-F]) and search for “arena.” And use [Ctrl-A(gain)] to search for the keyword “arena” again.
If the Dynamic Link Libraries (DLLs) in the shared arena are effectively shared, programs can (re)use a lot of fast, well-documented—and after years of OS/2 development—almost bullet-proof code with minimal system resources. These DLLs were meant for sharing. Loading a second instance of CMD.EXE consumes less memory than the first one.
And even if lack of main memory is not a problem today, your fast level 1 cache and processor profit from lean code because the level 1 (or 2) cache is the primary (available) memory of the fast processors of today. A program that has its working set in the cache of the processor would be super fast.
But on the other hand: If a program or a PM driver would allocate say 100 MB of unnecessary or poorly documented “bloatware” code to share with other OS/2 programs, all OS/2 programs would have 100 MB of virtual address space less to address because the data and code in the shared arena are part of the virtual address space of any program. So even allocating 300 MB of low private memory should be called a criminal offence, as it would reduce the shared arena to less then 200 MB.
When you choose for a periodic update in the PM version you see that the virtual memory consumption of processes like the second pmshell.exe (the Workplace Shell) and mozilla.exe grow the more the longer you use them. But after a certain point resource problems in the shared arena may suddenly show up, even if you still have 1 GB of memory available. And you have out of memory errors.
In these situations even Theseus won't start up (cannot find its DLLs), but Theseus also has got some CLI utilities that can work in virtual memory restricted situations. So if you got stuck and want to know if there's a relation with Virtual Memory usage, type [Ctrl-Alt-Delete] (using CAD handler) and go to the command line. Then run a batch like this:
rem Theseus_snapshot.cmd
cd cd<>Theseus
getram.exe 1 0 file %TEMP%\theseus.txt
type c:\config.sys >> %TEMP%\theseus.txt
call getlinmp.cmd >> %TEMP%\theseus.txt
start fte %TEMP%\theseus.txt
exit
The advantage of FTE (PM) over (A)E.EXE is that it shows the line numbers which helps you to identify the processes of the CLI version of Get Linear Memory by Process.
Free, Idle, and Locked Memory
Physical memory is divided into page frames of 4 KB. When virtual memory is committed, the linear address is mapped (attached) to the physical address of a page frame. In the case of shared memory, page table entries from several processes point to the same the physical address.
As soon as the virtual memory is deallocated, the page frame gets the label free. The memory content is not cleared, so free pages still contain the code of the former users. Free pages may be associated with memory objects. In this case the memory is allocated, but yet committed.
A page frame that has not been used recently is called idle. When there is a only a small pool of free memory, these Least Recently Used (LRU) pages can be detached and given to another virtual page, but if the contents has been modified (dirty idle), the Page Manager must first write them to disk.
Most physical memory can be swapped to disk (swappable memory). But device drivers and VPC could not function properly when their buffers were swapped to disk. So they lock them for long or short term (locked memory). And of course the operating system has components that should always be in RAM (resident memory).
Swapper
System > Swapper gives Theseus analysis of SWAPPER.DAT file. Although 32 bit OS/2 pages 4 KB page frames to the page file instead of swapping 64 KB segments, the 16 bit OS/2 name SWAPPER.DAT is still used.
Analysis of the SWAPPER.DAT file:
There are 32000 disk frames in SWAPPER.DAT (each is 4K bytes).
There are  535 frames used.   (2140K => 2.090M)
There are 31465 frames free.   (125860K => 122.910M)
There are 32000 frames total.  (128000K => 125.000M)

There are  220 frames compressed. (880K => 0.859M)
  (Compressed frames are not in SWAPPER.DAT.)
The MEMMAN setting is SWAP, PROTECT. The SWAPPER.DAT was
125 MB. Compressed frames are held in the kernel.
General System
Under System > General System you find more useful information.
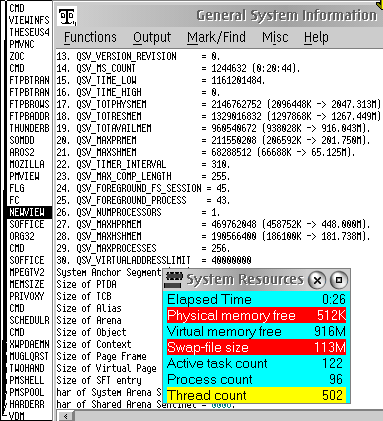
Figure 11. Theseus display of General System Information, Memsize display
-
General System Information shows the current kernel parameters, some of which were set in the CONFIG.SYS.
-
Device Drivers shows the device drivers loaded from the CONFIG.SYS and associated device names.
-
GDT displays information about the Global Descriptor Table.
-
Modules shows the loaded programs (EXE and DLL) and drivers (SYS, DLL).
-
The System Anchor Segment (SAS) is the common anchor for many system control blocks and control block chains according to the OS/2 debugging handbook.
-
Global Info Seg gives all kind of information about time and timing.
-
Open Files shows the open files in the System File table. This can be useful when you want to know which DLL has been used.
-
Process List list the active processes, their owned memory resources (Per Task Data Area, PTDA), number of threads and Process ID and name.
Theseus > General System > General System Information is my favourite. Especially the output of DosQuerySysInfo is interesting. You can update it using Misc > Contents update. It tells you something about the limitations of the OS/2 kernel in your current system. And that is what interests OS/2 power-users.
Following are the values from DosQuerySysInfo:
 1. QSV_MAX_PATH_LENGTH   = 260
23. QSV_MAX_COMP_LENGTH   = 255.
A full path can be up to 260 bytes long (1) and one component (name) 255 bytes (23).
 2. QSV_MAX_TEXT_SESSIONS = 16.
 3. QSV_MAX_PM_SESSIONS   = 16.
 4. QSV_MAX_VDM_SESSIONS  = 256.
OS/2 supports 16 full screen OS/2 text sessions, 16 graphical Presentation Manager sessions (PM/WPS, XFree86 server, Battle of Wesnoth) and 256 virtual DOS machines. Sessions as defined here have independent control of the mouse, the keyboard, and the screen in contrast to windowed PM sessions that share the mouse within a single PM session (Screen Group).
11. QSV_VERSION_MAJOR     = 20.
12. QSV_VERSION_MINOR     = 45.
13. QSV_VERSION_REVISION  = 0.
I am using the variant of 32 bit OS/2 2.0 called OS/2 4.5 (eCS 1.2).
17. QSV_TOTPHYSMEM  = 2146762752 (2096448K -> 2047.313M).
18. QSV_TOTRESMEM   = 1056301056 (1031544K -> 1007.367M).
19. QSV_TOTAVAILMEM =  745558016 ( 728084K ->  711.020M).
The total amount of physical memory (item 17) is 2047.313 MB (2 GB DRAM). The amount of non swappable resident system memory (item 18) 1007.367 MB. Most of it is JFS cache.
The amount of virtual memory that can be allocated by all protected mode processes (item 19) is 711.020 MB. But as the SWAPPER.DAT can grow to 2 GB this value (virtual memory resources) increases on demand.
The following values are more important. They have to do with the limited virtual address space in low memory.
20. QSV_MAXPRMEM = 264044544 (257856K -> 251.813M).
21. QSV_MAXSHMEM = 129695744 (126656K -> 123.688M).
The maximum amount of memory that a process can allocate in the low private arena (20) is 251.813 MB. Theseus says: “This number is advisory and is not guaranteed, since system conditions change constantly.” The same holds true for the maximum amount of memory that a process can allocate in the low shared arena (21). The shared arena is only 123.688 MB as PM, the WPS, the network, and other loaded applications have already used (512 - 251.831 - 123.688) = 136.481 MB of it.
The free virtual address space in the low shared arena is fragmented. So you might already have “out of memory” trouble when loading big shared DLLs within it.
27. QSV_MAXHPRMEM = 469762048 (458752K -> 448.000M).
28. QSV_MAXHSHMEM = 325189632 (317568K -> 310.125M).
QSV_MAXHPRMEM is the maximum amount of memory that this process can allocate in the high private arena. And QSV_MAXHSHMEM is the maximum amount of memory that a process can allocate in the high shared arena. Again the numbers are advisory but not guaranteed since the system conditions change constantly. But this high memory area (HMA) can give extra virtual address space to programs compiled for it.
29. QSV_MAXPROCESSES         = 256.
30. QSV_VIRTUALADDRESSLIMIT  = 40000000
QSV_MAXPROCESSES) use kernel defaults when not explicitly set (PROCESSES=).
QSV_MAXPROCESSES is the amount of processes that can run concurrently on SMP systems. It defaulted to 801 on my non-SMP 2 GB system, but as I
never used more then a few hundreds processes, I reduced the maximum of user processes reserved by the kernel to 256
with the CONFIG.SYS statement PROCESSES=256. And I think this made my system
more stable because it used less system resources. Just like reducing the number of the possible (but in practice
never reached) THREADS=520 or VIRTULALADRESLIMIT=1024 OS/2 limits did.
The QSV_VIRTUALADDRESSLIMIT=40000000 is given in hexadecimal. The decimal VIRTUALADDRESSLIMIT of my CONFIG.SYS was 1024 MB.
Conclusions
When more and more virtual memory is allocated by virtual memory hungry programs like the Mozilla family, the free pool of memory between the private and shared arenas shrinks. At a certain poit Theseus > System > Linear Usage by Process tells you that: “There is 0.000M between the private and shared arenas.”
There is 0.000M between the private and shared arenas.
Shared arena starts at 08C90000, which is 140.563M.
 Free memory from 08C90000 for 229.063M, which is equivalent to 3665 64K spaces.
And here the virtual memory problems start. There might still be enough free memory in the shared arena from 08C9 0000 to 1FFF FFFF, and even more free-able when you close or kill programs. But the freed memory can constitute relatively small memory objects in the shared arena. The OS/2 loader could place small DLLs in the virtual address space left by them, but not a big DLL that must contain more code and data, say a buffer or cache needing to allocate 30 MB continuous virtual address space.
Using Theseus I found that fragmentation of memory objects in the shared arena occurs inevitably when the OS/2 system loader loads and unloads shared DLLs. Virtual memory fragmentation destabilises all protected-mode OS/2 programs that allocate new memory objects that do no fit in the fragmented free space.
Among the protected-mode programs that suffered from this were the protected-mode shell Presentation Manager and the Workplace Shell. So the calling cards of OS/2 (not the kernel) become unstable when you run out of virtual memory. Then you have to rely on resident emergency shells like Watchcat and CAD handler. But programs that cannot allocate their expected memory become unstable and may even not respond to a hard kill. When this happens saving data and rebooting is the best you can do.
When OS/2 3.0 came out, 16 MB of RAM was meant for power systems. The OS/2 2.0 developers expected a free pool of memory between the private and shared arenas. They could not foresee huge programs like the current Mozilla or OpenOffice that almost completely fill the private, free, and shared arenas. But when this happens, DLLs like PMMERGE.DLL may be unable to keep the OS/2 PM and WPS GUI integrated.
Luckily, programs misusing a lot of virtual memory can easily be identified using Theseus > System > RAM usage by process. When you don't need them immediately, you had better close them, before the system (PM, WPS) gets stuck. In the case of the Mozilla family just closing the application and restarting them will free a lot of private and shared virtual memory. It gives fragmented (virtual memory) space to other applications. So you might keep going on some while. And you better do this before OpenOffice (PM) or the WPS does not respond to your mouse any more (as I found out writing this).
When Theseus > System > Linear Usage by Process finds exhausted free memory resources when starting up (say < 200 MB free linear memory), consider disabling system utilities in the CONFIG.SYS, Startup folder and STARTUP.CMD. And also look for big memory objects in the WPS with Linear Usage by Process. Maybe you find WPS DLLs that are not needed any more. Then you had better deregister them.
About the Watchcat addition WNICE(.DLL) Theseus said: “object is 32.000M.” So it used almost the virtual memory of the WPS. And it used it in any OS/2 process. Even if it was only using a few kilobytes privately. I liked Watchcat's WNICE plugin (it could change thread priorities on the fly), but I removed it when I realised its price in terms of shared virtual address space.
Also note that the printer drivers that are available in any process may be quite large. So deinstall the printer drivers in the objects that you don't need any more.
And at last: give OS/2 a corset by trimming some CONFIG.SYS settings may keep you going on in low shared memory conditions.
I have the following kernel-related CONFIG.SYS kernel settings:
REM [4] KERNEL DIRECTIVE STATEMENTS
DLLBASING=OFF
MEMMAN=SWAP,PROTECT
rem MEMMAN=SWAP,PROTECT,COMMIT
SWAPPATH=I:\ 30000 1024
THREADS=512
PROCESSES=192
PRIORITY=DYNAMIC
IOPL=YES
MAXWAIT=1
rem  When you do not need DOS or WIN/OS2
rem PROTECTONLY=NO
VIRTUALADDRESSLIMIT=1024
SET JAVA_HIGH_MEMORY=1
Thus ends this article about Theseus. Next month, we will look into virtual memory techniques in more detail.